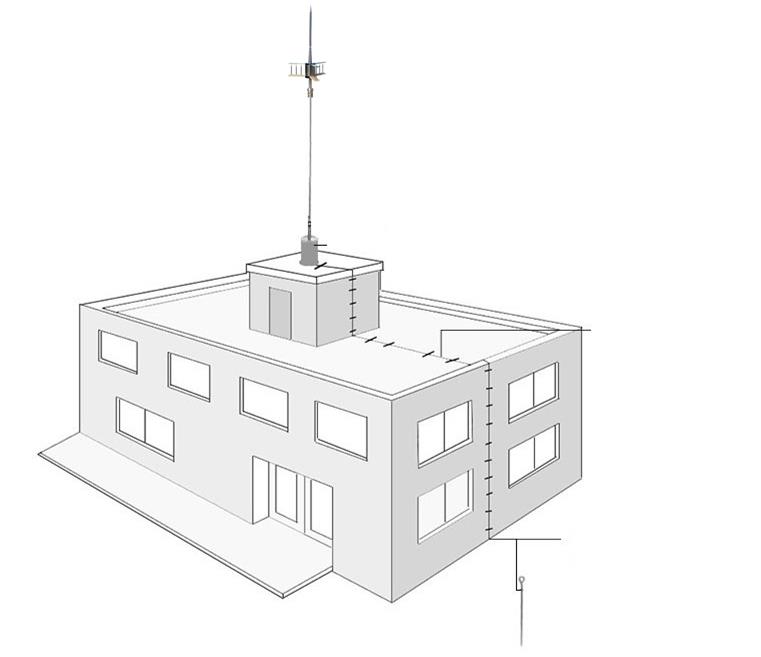
FM broadcast by radio transmission to transmit broadcast signals
I. Overview
The concept of frequency modulation (FM). FM is the main way to realize high-fidelity sound broadcasting and stereo broadcasting in modern times. It transmits audio signals in a frequency modulation mode. The carrier of the FM wave changes at the center frequency of the carrier as the audio modulation signal changes ( The center frequency before unmodulation) changes on both sides, and the frequency deviation change times per second is consistent with the modulation frequency of the audio signal. If the frequency of the audio signal is 1kHz, the frequency deviation change times of the carrier is also 1k times per second. The size of the frequency deviation depends on the amplitude of the audio signal.
The concept of stereo FM, stereo FM first encodes the signals of two audio frequencies (left and right channels) to obtain a set of low-frequency composite stereo signals, and then FM is performed on the high-frequency carrier. Stereo FM is divided into three types: frequency division system (and difference system), time division system, and directional signal system according to different processing methods for stereo. The sum difference system is commonly used now. The sum and difference system is in the stereo modulator, the left (L) and right (R) channel signals are encoded first to form the sum signal (L+R) and the difference signal (LR), and the sum signal is directly sent to the modulator The carrier constitutes the main channel signal for compatible listening with ordinary FM radio; the difference signal is sent to the balanced modulator to suppress carrier amplitude modulation on the subcarrier, and the obtained double sideband suppressed amplitude modulation wave is used as the subchannel signal, and then combined with the sum signal Mix to modulate the main carrier. The frequency range of the sub-channel signal is 23 to 53kHz (38±15kHz), which belongs to the super audio range and will not interfere with mono playback. Since the sub-carrier of the sub-channel AM wave is suppressed, the stereo radio cannot directly demodulate the outgoing signal. Therefore, a 38kHz signal with the same frequency and phase as the sub-carrier of the transmitting system should be generated in the radio to be demodulated. For this reason, at the transmitting end, at the interval between the main and sub-channel frequency spectrum, another 19kHz (1/2 subcarrier frequency) pilot signal (PilotTone) is transmitted to "guide" the 38kHz regenerated subcarrier in the radio. This modulation method is called pilot frequency, and it is also the most widely used method of frequency division in stereo broadcasting.
Correspondingly, in order to measure FM signals and stereo FM signals, the following parameters are usually measured in the world.
1.1, occupied bandwidth
According to ITU recommendations, the measurement of signal bandwidth is usually based on the spectrum using two methods: "β% occupied bandwidth" and "x-dB bandwidth". The β% occupied bandwidth is shown in Figure 1. The measurement method is to first count the total power in the monitoring bandwidth, and then accumulate the power of the spectral lines from both sides to the middle on the spectrum until the power and the total power (β/2 )%, respectively defined as f1 and f2, the defined bandwidth is equal to f2-f1; and the x-dB bandwidth is shown in Figure 2. The measurement method is to find the peak or the highest point on the spectrum first, and then from the highest point to both sides The two spectral lines make all the spectral lines outside these two spectral lines at least xdB smaller than the highest point, and the frequency difference corresponding to the two spectral lines is the bandwidth.
In the ITU and radio and television recommendations, β usually takes 99, and x usually takes 26, which is the 99% power bandwidth and 26dB bandwidth that are often said.
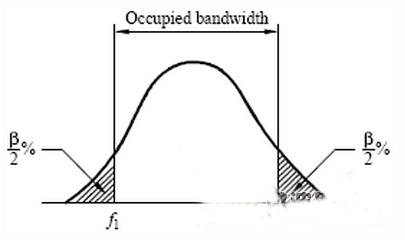
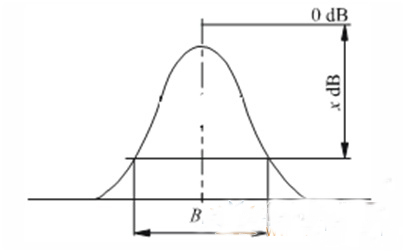
Figure 2. x-dB bandwidth
1.2 Frequency deviation
Frequency Deviation in the FM signal refers to the amplitude of the frequency swing of the FM wave, which changes with the fluctuation of the information (or voice) waveform. The frequency deviation usually measured by an instrument or receiver actually refers to the maximum frequency deviation within a period of time. The distribution and size of the maximum frequency deviation determine the sound quality and volume of the audio heard, which also determines the emission of FM radio. quality.
The main purpose of this article is to study the transmission quality of FM broadcasting, so according to the above description, the frequency offset index should be paid attention to.
ITU-R has a detailed description of the measurement of FM signal frequency deviation:
The frequency deviation measurement method is to take a period of time (the recommended time length is 50ms) to measure the frequency deviation relative to the carrier at each sampling point, and the maximum value is the maximum frequency deviation. But in order to have a deeper understanding of the frequency offset, a statistical histogram updated over time can be used to express its signal characteristics. The histogram calculation method of frequency deviation is as follows:
1). Measure the N maximum frequency deviations with a period of 50ms. The length of the measurement period will significantly affect the histogram, so a fixed measurement period is required to ensure the repeatability of the measurement results. At the same time, selecting 50ms as the measurement period can ensure that the maximum frequency deviation can still be effectively measured when the modulation frequency is as low as 20Hz.
2). Divide the frequency deviation range that needs to be counted (0~150kHz in this article), using 1kHz (resolution) as the unit, and divide it into equal parts (in this article, 150 equal parts).
3). In each aliquot, count the number of points on the corresponding frequency value, and the waveform obtained should be roughly as shown in Figure 3 (ie, frequency offset distribution histogram), where the X axis represents the frequency, and the Y axis represents the maximum frequency. The number of points that fall on the corresponding frequency value.
Figure 3. Histogram of frequency offset distribution
4). Accumulate the number of points in each aliquot, and normalize N with a percentage as the unit to get the graph shown in Figure 4 (ie the histogram of the cumulative distribution of frequency deviation), where the X axis represents frequency, and Y The axis represents the probability that the maximum frequency deviation falls within the frequency range of the corresponding frequency value. The probability starts at 100% at the far left and ends at 0% at the far right
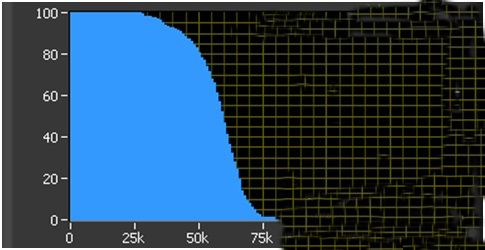
Figure 4. Histogram of frequency offset cumulative distribution
At the same time, ITU-R gives a reference specification (SM1268) for the cumulative distribution of the maximum frequency deviation, as shown in Figure 5.
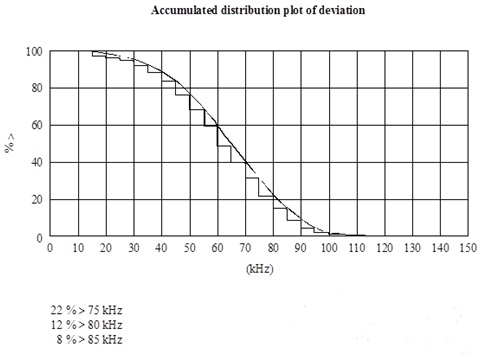
Figure 5. Reference specification for cumulative distribution of maximum frequency deviation
The specification states that: the statistical percentage of frequency offset distribution greater than 75kHz does not exceed 22%, the statistical percentage of frequency offset distribution greater than 80kHz does not exceed 12%, and the statistical percentage of frequency offset distribution greater than 85kHz does not exceed 8%.
Based on the above theory, it can be known that the transmission quality of FM signals is related to the magnitude of the FM carrier frequency deviation after the original audio signal is modulated. Measuring and improving the cumulative distribution of the maximum frequency deviation will help improve the transmission quality of FM signals.
2. Hardware foundation
This article uses a modular broadcast monitoring receiver that uses the current advanced radio monitoring technology and complies with ITU specifications. The receiver consists of a high-end digital radio receiving module and the latest embedded processor. The software-defined radio architecture and high-speed data bus ensure the scalability and test speed of the receiver. The receiver demodulates and measures FM signals in accordance with International Telecommunication Union Radiocommunication Sector (ITU-R) standards and spectrum monitoring manuals, and provides audio and baseband analysis functions specifically for broadcast monitoring applications. The specific characteristic parameters are as follows:
Occupied Bandwidth (OccupiedBandwidth
Carrier Offset (CarrierOffset)
Power in Band (PowerinBand)
FM Maximum Deviation (FMMaximumDeviation)
Maximum frequency deviation of main channel signal (Maximumfrequencydeviationofmainchannel(L+R))
The maximum frequency deviation of the pilot signal (Maximumfrequencydeviationofthepilottone)
The maximum frequency deviation of subchannel signal (Maximumfrequencydeviationofsubchannel (L-R)) The structure and principle block diagram of the broadcast monitoring receiving equipment is shown in Figure 6. The digital radio receiving module is installed in a chassis with a high-speed data bus and an industrial reinforced frame. The embedded controller of this receiver uses a high-speed processor, which is responsible for controlling the receiving module and processing the collected data.
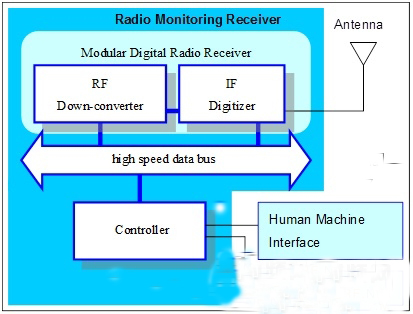
Figure 6. Block diagram of the structure of the broadcast monitoring receiver
The digital radio receiving module includes two sub-modules: RF down-conversion module and high-speed intermediate frequency acquisition module.
The RF down-conversion module down-converts the RF frequency band of interest to an intermediate frequency signal, and then transmits the intermediate frequency signal to the high-speed intermediate frequency acquisition module.
The core of the high-speed IF acquisition module is a high-speed ADC (analog-to-digital converter) and a dedicated digital down-conversion chip that provides hardware processing functions. Digital down-conversion processing extracts broadband signals in real time and down-converts them to baseband, which is suitable for capturing broadcast signals, wireless signals and other communication signals. Digital down-conversion processing can also convert the collected intermediate frequency signal waveform into I/Q complex signal data output. The high-speed intermediate frequency acquisition module uses a patented high-speed dedicated chip for data transmission, and transmits data to the controller through DMA, reducing the controller CPU load, allowing it to focus on completing advanced analysis and processing, graphical display, and data exchange. . As shown in Figure 7:
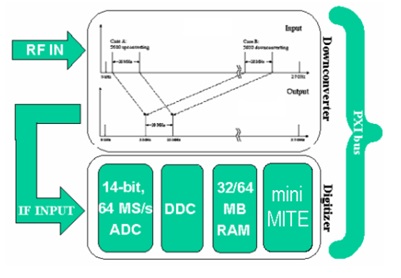
Figure 7. Digital radio receiver module architecture
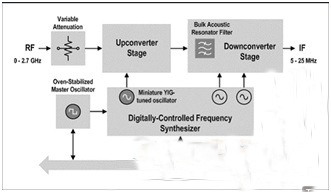
The RF down-conversion module first attenuates the signal as specified by the user, passes the surface acoustic wave filter to filter out the image frequency after up-conversion, and then performs multi-stage down-conversion, and finally outputs an intermediate frequency signal. The RF down-conversion module uses a high-precision and high-stability constant temperature crystal oscillator as the system reference clock to provide extremely high frequency accuracy.
In order to facilitate compact packaging, the module uses a high-performance micro YIG oscillator to generate the high-frequency local oscillator signal required for the up-conversion stage. The YIG oscillator is a kind of oscillator that can generate very pure high-frequency signals and is often very large. The RF down-conversion module in the equipment utilizes a breakthrough technology in this field and uses a very small YIG oscillator in the design. The YIG oscillator can be tuned to a specified frequency band, allowing users to set the frequency required by the RF downconversion module. The comprehensive frequency planning and multi-stage frequency conversion architecture of the RF down-conversion module ensure the excellent characteristics of the instrument's low spurious response and large dynamic range. As shown in Figure 8:
 \
\
Figure 8. RF down-conversion module architecture
This article analyzes the relationship between the quality of FM broadcast transmission and the cumulative distribution of frequency deviation, starting from adjusting the audio processor of the transmitter, using station A (including audio processor A and transmitter A) and station B (including audio processor B and transmitter Machine B) To compare samples, the following experiments are designed.
This experiment mainly improves the cumulative distribution of the frequency deviation of the FM signal by adjusting the audio processor to verify its relationship with the quality of FM broadcast transmission.
3.2, test
The experiment uses the audio file of a certain broadcast program, processes it through audio processors A and B, and transmits them to transmitters A and B for transmission at the same time. The two transmitters use the same settings. The radio monitoring receiver was used to record the radio frequency signals from transmitters A and B respectively, and the recorded signals were used for statistical analysis of the maximum frequency deviation of the FM signal according to the ITU-RSM.1268.1 standard. The description of the analysis experiment process is shown in Figure 9. The result is shown in Figure 10
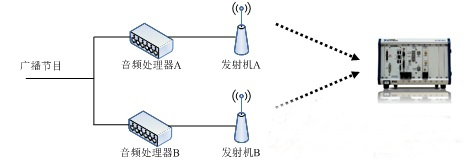
Figure 9. Test process
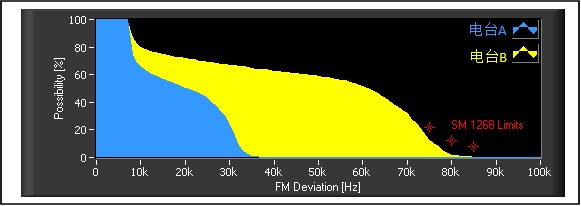
Figure 10. Cumulative frequency deviation distribution diagram
From the statistical distribution of the frequency deviation obtained from the experiment, for the same audio file, the signal frequency deviation of station A is mainly distributed from 10kHz-95% to 35kHz-5% in a half-bell curve, and the signal frequency deviation of station B is mainly The distribution shows a half-bell curve from 10kHz-95% to 75KHz-95%. The time domain signals of the two stations show different probability distribution characteristics. In contrast, the signal frequency offset of station B is larger.
From a listening point of view, the audio quality of station B is better than that of station A, and the volume is louder, that is, the transmission quality is better.
3.3, debugging
Since the audio files transmitted to the two audio processors are the same, the settings of the two transmitters are also the same, but the signal frequency offset distribution of station A and station B are different, indicating that the audio processors of the two stations are different. The signal frequency deviation amplitude of the same audio file processed by audio processor A is relatively small, indicating that the setting of audio processor A has not reached the ITU-RSM1268.1 standard. Therefore, after adjusting the audio processor A according to the recommended standard, theoretically higher transmission quality can be achieved. For this reason, the following verification experiment was designed.
3.4, verification
A broadcast program is processed by audio processor A and then transmitted to transmitter A for transmission. The engineer adjusts audio processor A under the condition of uninterrupted transmission. The radio monitoring receiver receives the radio frequency signal of station A and follows ITU-RSM.1268.1 standard to perform statistical analysis of the maximum frequency deviation of the FM signal, and compare the data before and after adjusting the audio processor A. The description of the verification experiment is shown in Figure 11.
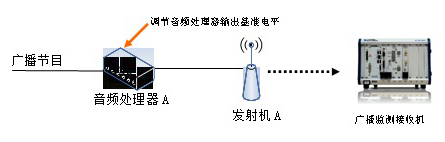
Figure 11. Test process
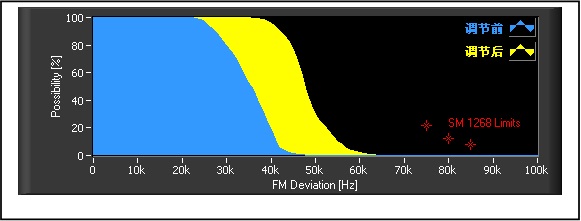
Figure 12. Distribution of cumulative frequency deviation
From the statistical distribution of frequency deviation, for the same program source, the signal frequency deviation before adjustment is mainly distributed from 25kHz-95% to 45kHz-5% in a half-bell curve, and the signal frequency deviation after adjustment is mainly distributed from 45kHz-95%. It shows a half-bell curve to 55KHz-95%. In contrast, the adjusted signal frequency offset value is larger, and the distribution is more full. From a listening perspective, the adjusted sound quality and volume are significantly improved compared to before.
Four, verification experiment conclusion
In the case of the same program source, by adjusting the reference output level of the audio processor, the frequency offset distribution can be improved to make it fuller and the frequency offset value is larger.
For the same audio source, the maximum frequency deviation distribution after FM modulation can affect the volume and saturation of the demodulated sound. By adjusting the parameter settings of the audio processor, the FM signal is more in line with the ITU-R specification, which can make the listening sound louder and fuller. Therefore, the use of broadcast monitoring equipment to detect FM broadcast parameters and adjust the equipment in the broadcast link according to the ITU-R standard for these parameters can obtain higher transmission quality.
This also shows that the use of broadcast monitoring equipment to monitor FM broadcast is an effective means to ensure the quality of FM broadcast transmission.
V. Outlook
The broadcast monitoring receiver based on the software radio architecture used in this article is a single-channel acquisition device with relatively few test parameters, and manual analysis is required after acquisition, which is relatively inefficient. With the development and progress of science and technology, combined with the problems encountered in the experiment, some prospects for the future FM broadcast monitoring and receiving equipment are proposed:
1. Real-time recording of full-band FM broadcast signals from 87MHz to 108MHz.
2. Equipped with a large-capacity disk array, which can record around the clock and realize advanced functions such as timing recording.
3. It can be controlled remotely to realize functions such as unattended monitoring, automatic analysis and generation of reports.
4. Support the database, which can reproduce the frequency spectrum and audio frequency at any time and at any frequency.
5. Diversified system configuration can meet the needs of different customers.
6. The modular design of software and hardware is convenient for system expansion and secondary development.
Our other product: